2025: Volume 2, Issue 1
Current Issue
 Abstract
  PDF
PDFNeurofilament Light Chain is Elevated - While C-X-C Motif Ligand 13 Remains Unchanged in Patients with Diabetic Polyneuropathy: A Pilot Study
Julia Runge Strøm Olsen1,*, Henry Christensen1, Dorte Aalund Olsen1, Worud Mahmoud2, Ole Winther Rasmussen2, Ivan Brandslund1,3, Eva Rabing Brix Petersen1,4
1Biochemistry & Immunology, University Hospital of Southern Denmark, Vejle, Denmark
2Department of Internal Medicine and Endocrinology, University Hospital of Southern Denmark, Kolding, Denmark
3Department of Regional Health Research, University of Southern Denmark, Denmark
4Biochemistry & Immunology, Hospital of Southern Jutland, Denmark
*Corresponding author: Julia Runge Strøm Olsen, MD, Biochemistry & Immunology, University Hospital of Southern Denmark, Beriderbakken 4, 7100 Vejle, Denmark, Tel: +457940 6511; Email: [email protected]
Received Date: June 17, 2025
Published Date: July 09, 2025
Citation: Olsen JRS, et al. (2025). Neurofilament Light Chain is Elevated - While C-X-C Motif Ligand 13 Remains Unchanged in Patients with Diabetic Polyneuropathy: A Pilot Study. Diab Res. 2(1):6.
Copyrights: Olsen JRS, et al. © (2025).
ABSTRACT
Valid and responsive biomarkers specific to diabetic polyneuropathy (DPN) could provide a time-efficient and objective tool for identifying and monitoring disease progression. We investigated whether neurofilament light chain (NfL) and C-X-C motif ligand 13 (CXCL13) levels are associated with the presence of DPN in patients with type 2 diabetes (T2D). In this retrospective case-control study, 192 participants were selected from the Vejle Diabetes Biobank and stratified into three groups: T2D with DPN (T2D +DPN, n=42), T2D without DPN (T2D –DPN, n=75), and non-diabetic, neurologically healthy controls (n=75). DPN was defined using ICD-10 codes from the Danish National Patient Registry. NfL and CXCL13 concentrations were measured using Single molecule array (Simoa) technology. Patients with T2D +DPN had significantly higher NfL levels than both T2D –DPN (p=0.0042) and control groups (p=0.0037). NfL levels correlated with the urine albumin/creatinine ratio (R=0.59, p<0.001), suggesting that both may reflect a common underlying mechanism of tissue damage. CXCL13 levels did not differ significantly between groups. These findings support NfL as a biomarker reflecting axonal damage in DPN, although its lack of specificity limits its diagnostic utility. Longitudinal studies are warranted to assess the value of NfL in disease progression and its potential role in individual monitoring.
Keywords: Diabetes, Neurological Diseases, Diabetic Polyneuropathy, Diabetic Neuropathy, Biomarkers
ABBREVIATIONS
DPN: Diabetic Polyneuropathy; NfL: Neurofilament Light Chain; CXCL13: C-X-C Motif Ligand 13; T2D: Type 2 Diabetes; T2D +DN: Type 2 Diabetes with Diabetic Neuropathy; T2D–DN: Type 2 Diabetes Without Diabetic Neuropathy; VDB: Vejle Diabetes Biobank; CNS: Central Nervous System; ICD-10: International Classification of Diseases.
INTRODUCTION
According to WHO, 830 million individuals worldwide had diabetes in 2022 [1]. The increasing prevalence has led to more chronic complications, with diabetic neuropathy affecting up to 50% of individuals with type 1 and 2 diabetes (T2D) [2-4].
Early diagnosis of diabetic polyneuropathy (DPN) is essential for enabling timely intervention and preventing progression [3]. DPN is a diagnosis of exclusion and require physical examinations such as vibration, detection and sensory tests supplemented by symptom questionnaires [3-5]. In some cases, nerve conduction examinations and skin biopsies assessing intraepidermal nerve fiber density are necessary. These methods are often painful, time-consuming, and require specialized skills, limiting their broader clinical application. A blood-based biomarker for DPN could provide a time-efficient and objective tool for identifying and monitoring disease progression.
Neurofilament light chain (NfL) has been widely studied for its potential to quantify axonal damage in neurological diseases [6,7]. NfL is a type IV intermediate filament of the axonal cytoskeleton that provides structural stability and determines axonal diameter [8,9]. Upon axonal injury, NfL is released from axons into the circulation [10]. There is growing scientific evidence supporting the use of NfL as a biomarker associated with neurodegenerative diseases [11-18] and peripheral neuropathies in humans [19-23]. While evidence linking NfL and DPN is limited, some studies indicate a potential association. One study found that higher serum NfL levels correlated with DPN and somatic nerve dysfunction [24], while another showed that yearly increases in NfL were linked to more severe nerve damage and higher DPN risk [25]. These findings suggest the potential of NfL for disease monitoring, but it remains unclear whether NfL levels measured at a random time point can serve as an initial biomarker for identifying DPN [24,25].
In addition to neurofilaments, the chemokine C-X-C motif ligand 13 (CXCL13) has also been identified as a potential biomarker in neurological diseases [26]. CXCL13 is constitutively expressed in secondary lymphoid organs, where it plays a key role in the immune system by recruiting B cells and CD4+ T follicular helper cells [26]. Neuroinflammation results from immune-nervous system interactions [27,28], and mouse models suggest that increased CXC chemokine signaling contributes to nerve damage and pain hypersensitivity in diabetes [29]. Elevated CXCL13 levels have been found in demyelinating nerves and inflammatory demyelinating neuropathies in both mice and humans [30]. However, no previous study has investigated a potential correlation between CXCL13 levels and patients with T2D and DPN.
This pilot study aimed to explore and compare the utility of CXCL13 and NfL as biomarkers for detecting DPN in patients with T2D. We assessed NfL and CXCL13 levels in patients with T2D, with and without DPN, comparing these to a control group without diabetes or neurological disorders. Additionally, we explored the association between NfL levels and clinical covariates in patients with and without DPN.
MATERIALS AND METHODS
Participants and Characteristics
The case-control study population was recruited from the Vejle Diabetes Biobank (VDB) [31]. The biobank holds 3,320 patients with diabetes and 4,255 individuals without diabetes. The VDB was established between 2007 and 2010 as a regional biobank containing blood, DNA, and urine samples from patients with diabetes, as well as a gender- and age-matched control population aged 25 to 75 years. The biobank assessed the prevalence of diabetes and quality of diabetes treatment in a specified Danish region. Furthermore, the VDB facilitates collaborative research on the etiologies of diabetes and its complications, as well as studies investigating prognostic and predictive biomarkers [31]. Subjects eligible for the cohort were identified using information from the civil registration system [32,33]. The patients’ verification of the diabetes diagnosis was considered the gold standard [34]. The patients with diabetes were identified and included based on information about: HbA1c values, prescription for oral anti-diabetic agents or insulin and all patients registered in the Danish National Patient Registry [35] with a contact (inpatient- or outpatient-based) at hospitals with a diabetes diagnosis. There were no specific requirements regarding the duration of diabetes in patients at the time of inclusion in the biobank. The VDB study population and its outcomes have previously been described in detail [31].
Covariates
Anthropometric data were collected through physical examinations, questionnaires, and interviews conducted at the time of inclusion in the Biobank. The data included height, weight, BMI, waist and hip circumference, and blood pressure. Additional questionnaire data covered lifestyle factors (smoking, alcohol, and exercise), medical history (diabetes onset, cardiovascular and cerebral diseases, and diabetic complications), family history of diabetes, and medication use (diabetes and other treatments). The samples for each participant were collected at the time point of entrance in the cohort. Blood analyses included HbA1c, fasting plasma glucose, C-peptide, lipid profile (triglycerides, total cholesterol, HDL, LDL), CRP, albumin, calcium, ALAT, and creatinine. Urine analyses included albumin, creatinine, total protein, and the albumin/creatinine ratio. GFR was estimated using the CKD-EPI equation [36].
DPN assessment – study population
This pilot study focused on 225 participants recruited from the VDB. By linking the cohort to the Danish Civil Registration System [37] and the Danish National Patient Registry [35], we used the International Classification of Diseases (ICD-10 codes) to identify T2D patients with hospital-diagnosed DPN [38]. ICD-10 has been in use in Denmark since 1994 and all citizens’ contacts with the hospital system are registered in the Danish National Patient Registry [35]. The participants in the present study were stratified into three groups, each consisting of 75 individuals: T2D +DPN: Patients with T2D and DPN at the time of entrance in VDB. T2D –DPN: Patients with T2D and no DPN at the time of entrance in the VDB. Controls: Age- and sex-matched individuals without diabetes and DPN at the time of entry into the VDB. Furthermore, diagnoses of central nervous system (CNS) diseases that could influence NfL levels were retrieved from Danish national registers. Participants with CNS diseases that could influence NfL levels were excluded from all groups. Diagnoses apply from 5 years before to 6 months after the sampling date. See Supplementary Table S1 for details for both inclusion and exclusion ICD-codes.
Ethics
The study was approved by the Danish Data Protection Agency (j. no. 2006-53-1385 and j. no. 2008-58-0035) and by The Regional Committees on Health Research Ethics for Southern Denmark (j. no S-20210125).
Laboratory analyses
NfL and CXCL13 Analysis
Commercial available single-plex assays for the Single molecule array (Simoa) HD-1 Analyzer (Quanterix©, Billerica, MA, USA) were used to quantify NfL(103186) and CXCL13(102635) in EDTA plasma samples. The Simoa uses the same reagents as conventional ELISA but uses femtoliter-sized reaction chambers approximately 2 billion times smaller than conventional ELISA. This will result in a rapid buildup of fluorescence if a labeled protein is present making it possible to detect single molecules. The instrument has previously been described in detail [39].
The samples were diluted four fold in buffer included in the kits and analyzed randomly and blinded to clinical data. Limit of detection for NfL and CXCL13 were 0.038 ng/L and 0.048 ng/L, respectively. The functional lower limit of quantification was 0.696 ng/L for NfL and 0.28 ng/L for CXCL13. To evaluate and monitor assay performance over time, three quality controls, two provided by the manufacturer and one in-house prepared serum pool, were included in each run. The analytical variations were 7-13% for NfL and 7-19% for CXCL13.
Statistical methods
Participant characteristics at entry into the biobank cohort are reported by DPN status for T2D participants. To assess potential sex-specific differences for relevant covariates, patient characteristics were stratified by sex and analysed separately. Data are presented as medians and 25th–75th percentiles for continuous variables and as frequencies and proportions for categorical variables. Statistical methods used for p-value calculations: Pearson’s Chi-squared test was used to assess associations between categorical variables. When cell frequencies were < 5, Fisher’s exact test was applied as an alternative. The Wilcoxon rank sum test was used to compare medians between two groups of continuous data, while the Kruskal-Wallis rank sum test extended this comparison to three groups.
The three groups, as shown in Figure 1, were analysed for deviations from a normal distribution using the Shapiro-Wilk test. Since the groups showed deviations from normality, they were log-transformed. However, as they still deviated from normality after log transformation, the groups were compared using the non-parametric Kruskal-Wallis test. Although the Kruskal-Wallis test does not assume normality, it is necessary to check for heteroscedasticity of variances. For this, we applied Levene’s test, and the deviation was found to be acceptable. As a post hoc test, we used Dunn’s test to determine which groups differed significantly, with Holm’s method applied for p-value correction to account for multiple comparisons.
To explore the relationships between NfL and HbA1c, as well as NfL and the urine albumin-creatinine ratio across different patient groups, a correlation analysis was conducted. Spearman's rank correlation coefficient was calculated to quantify the strength and direction of the monotonic relationships. The ellipses, which represent regions containing the majority of the data under the assumption of normality, indicate the correlation, with their shape and tilt reflecting the strength and direction of the relationship. Although the data are not assumed to follow a normal distribution, the ellipses serve as a visual guide, with outliers identified as points outside the 95% confidence region based on a normality assumption.
Receiver Operating Characteristic (ROC) curves were generated using logistic regression to evaluate the diagnostic performance of NfL and CXCL13 in distinguishing between different groups within the cohort. The 95% confidence intervals (CIs) were calculated using the DeLong method. All statistical analyses were performed using R (version 4.4.1).
RESULTS
We included 42 patients with T2D +DPN, 75 patients with T2D -DPN, and 75 sex- and age-matched control individuals without diabetes or neurological disorders. NfL and CXCL13 was quantified in 192 participants in order to study whether the biomarkers are useful for detecting DPN in participants with T2D. Results are presented in Table 1.
Initially, participants meeting the inclusion and exclusion criteria based on ICD-10 codes were identified from the VDB, with an intended total of 75 participants in each group (225 in total). However, a detailed review of ICD-10 classifications revealed misclassification in some cases within the T2D +DPN group. As a result, the inclusion and exclusion criteria were refined, and the diagnosis codes were revised accordingly, as outlined in Supplementary Table S1.
Table 1 presents the baseline descriptive statistics of the study population stratified by T2D and DPN status. Participants with T2D and DPN were more likely to have a larger waist circumference, higher BMI, and elevated HbA1c levels compared to both controls and T2D participants without DPN. They also had a significantly longer disease duration, along with lower HDL levels. Additionally, the urine albumin-creatinine ratio was significantly higher in +DPN compared to –DPN participants, (median of 11 and 8 mg/g, respectively).
Table 1. Baseline clinical characteristics in the total study sample by T2D and DPN status
|
Characteristics |
Controls |
T2D -DPN |
T2D +DPN |
p-value |
|
Enrolled |
75 |
75 |
42 |
|
|
Sex, n (%) |
0.67 |
|||
|
Women |
37 (49) |
37 (49) |
24 (57) |
|
|
Men |
38 (51) |
38 (51) |
18 (43) |
|
|
Smoking status, n (%) |
0.44 |
|||
|
Never |
30 (40) |
29 (39) |
21 (50) |
|
|
Former (> 6 months) |
36 (48) |
30 (40) |
13 (31) |
|
|
Daily |
8 (11) |
12 (16) |
7 (17) |
|
|
Occasionally |
0 (0) |
3 (4.0) |
1 (2.4) |
|
|
Unknown |
1 (1.3) |
1 (1.3) |
0 (0) |
|
|
Alcohol consumption |
||||
|
Women, n (%) |
0.006* |
|||
|
No alcohol |
7 (19) |
17 (46%) |
13 (54%) |
|
|
Occasionally |
6 (16) |
9 (24%) |
3 (13%) |
|
|
1-7 units per week |
14 (38) |
10 (27%) |
6 (25%) |
|
|
7-14 units per week |
9 (24%) |
0 (0%) |
2 (8.3%) |
|
|
14-21 units per week |
1 (2.7%) |
1 (2.7%) |
0 (0%) |
|
|
>21 units per week |
0 (0%) |
0 (0%) |
0 (0%) |
|
|
Men, n (%) |
0.042* |
|||
|
No alcohol |
4 (11%) |
6 (16%) |
6 (33%) |
|
|
Occasionally |
2 (5.3%) |
1 (2.6%) |
4 (22%) |
|
|
1-7 units/week |
16 (42%) |
22 (58%) |
6 (33%) |
|
|
7-14 units/week |
7 (18%) |
7 (18%) |
1 (5.6%) |
|
|
14-21 units/week |
7 (18%) |
2 (5.3%) |
1 (5.6%) |
|
|
>21 units/week |
2 (5.3%) |
0 (0%) |
0 (0%) |
|
|
Age at time of diagnosis (years) |
56 (50-62) [9] |
56 (48-61) [5] |
0.56 |
|
|
Years diagnosed |
6.0 (3-9) [9] |
9.0 (5-12 )[5] |
0.021* |
|
|
Age December 31, 2006 (years) |
62 (55-68) |
62 (55-67) |
62 (58-67) |
0.61 |
|
HbA1c (%) |
5.60 (5.3-5.7) |
6.40 (6-6.7) |
7.20 (6.7-7.9) |
<0.001* |
|
HbA1c, IFCC (mmol/mol) |
38 (34-39) |
46 (42-50) |
55 (50-63) |
<0.001* |
|
CRP (mg/L) |
1.30 (0.7-2.8) |
1.70 (0.7-3.8) |
2.05 (1.3-4.7) |
0.058 |
|
Lipids (mmol/L) |
||||
|
Total cholesterol |
5.20 (4.7-5.6) |
4.30 (3.7-4.9) |
3.90 (3.5-4.4) |
<0.001* |
|
HDL cholesterol |
1.56 (1.22-1.75) |
1.33 (1.04-1.65) |
1.18 (1.02-1.39) |
<0.001* |
|
LDL cholesterol |
3.13 (2.55-3.63) |
2.14 (1.78-2.64) |
1.98 (1.61-2.27) |
<0.001* |
|
Triglycerides |
1.05 (0.81-1.69) |
1.34 (1.09-1.91) |
1.66 (1.28-2.49) |
<0.001* |
|
Renal parameters |
||||
|
P-Creatinine (µmol/L) |
||||
|
Women |
69 (64-71) [33] |
67 (58-77)[1] |
68 (61-79) |
0.8 |
|
Men |
83 (73-92) [31] |
84 (75-91) |
97 (82-133) |
0.091 |
|
Urine albumin-creatinine (mg/g) |
n.a. |
8 (5-14) |
11 (6-25) |
0.042* |
|
eGFR (mL/min/1.73m2) |
83 (77-95) [64] |
86 (75-95)[1] |
81 (65-91) |
0.16 |
|
BMI |
||||
|
Women |
26 (24-28) |
28 (25-37) |
30 (26-35) |
0.002* |
|
Men |
27.3 (25.2-29.7) |
28.5 (25.9-30.7) |
31.4 (28.7-32.9) |
0.013* |
|
Waist circumference (cm) |
||||
|
Women |
86 (79-94) |
99 (92-119) |
105 (89-114) |
<0.001* |
|
Men |
100 (92-107) |
99 (96-111) |
111 (106-115) [1] |
0.003* |
|
Antidiabetic treatment, n (%) |
<0.001* |
|||
|
Orala exclusive |
|
46 (61) |
16 (38) |
|
|
Insulin and orala |
4 (5.3) |
8 (19) |
||
|
Insulin exclusive |
5 (6.7) |
14 (33) |
||
|
None |
75(100) |
20 (27) |
4 (9.5) |
|
|
Antihypertensive treatment, n (%) |
||||
|
ACE inhibitors |
6 (8.0) |
29 (39) |
20 (48) |
<0.001* |
|
AT2 Antagonists |
5 (6.7) |
16 (21) |
12 (29) |
0.005* |
|
Calcium blockers |
7 (9.3) |
18 (24) |
19 (45) |
<0.001* |
|
β-blockers |
8 (11) |
18 (24) |
14 (33) |
0.010* |
|
Diuretics |
14 (19) |
28 (37) |
23 (55) |
<0.001* |
|
Lipid lowering medicationb, n (%) |
16 (21) |
57 (76) |
34 (81) |
<0.001* |
|
CXCL13 (ng/L) |
33 (24-45) |
34 (26-46) |
37 (26-50) |
0.27 |
|
NfL (ng/L) |
13 (10-16) |
13 (10-17) |
17(13-22) |
0.002* |
Notes: Data are median (25th percentile -75th percentile) unless stated otherwise, missing numbers [n].
aOral antidiabetic treatment: GLP-1 analogs, DPP-IV inhibitors, Metformin, Sulfonylureas, Glitazones.
bLipid-lowering medication: Simvastatin, fibrates and nicotinic acid, p-values, *P <0.05.
Abbreviations: T2D: Type 2 Diabetes; DPN: Diabetic Polyneuropathy; BMI: Body Mass Index; IFCC: International Federation of Clinical Chemistry; HDL: High Density Lipoprotein; LDL: Low Density Lipoprotein; HbA1c: Glycated Hemoglobin; ACE: Angiotensin-Converting-Enzyme Inhibitors; AT2: Angiotensin 2 Receptor Antagonists; CXCL13: C-X-C Motif Ligand 13; NfL: Neurofilament Light Chain; n.a: not available.
Distribution and Significance of NfL and CXCL13 Levels in Diabetic Polyneuropathy
Figure 1 illustrates the distribution of NfL and CXCL13 levels (median [25th percentile, 75th percentile]) across the three groups: T2D +DPN, T2D -DPN, and controls. NfL levels are significantly higher in the T2D +DPN group (17 [13-22]) compared to both controls (13 [10-16]) and the T2D -DPN group (13 [10-17], p = 0.002) (Figure 1, Table 1). In contrast, CXCL13 levels are slightly higher in the T2D +DPN group (37 [26-50]) compared to the T2D -DPN group (34 [26-46]) and controls (33 [24-45]); however, this difference is not statistically significant (p = 0.27) (Figure 1, Table 1).
For NfL, a statistically significant difference was observed between the groups (Kruskal-Wallis test, p = 0.0023). Post hoc analysis revealed significantly higher NfL levels in the T2D + DPN group compared to both the T2D - DPN group (p = 0.0042) and the control group (p = 0.0037). No significant difference was observed between the T2D -DPN group and controls. In contrast, CXCL13 levels did not differ significantly between the groups (Kruskal-Wallis test, p = 0.27).
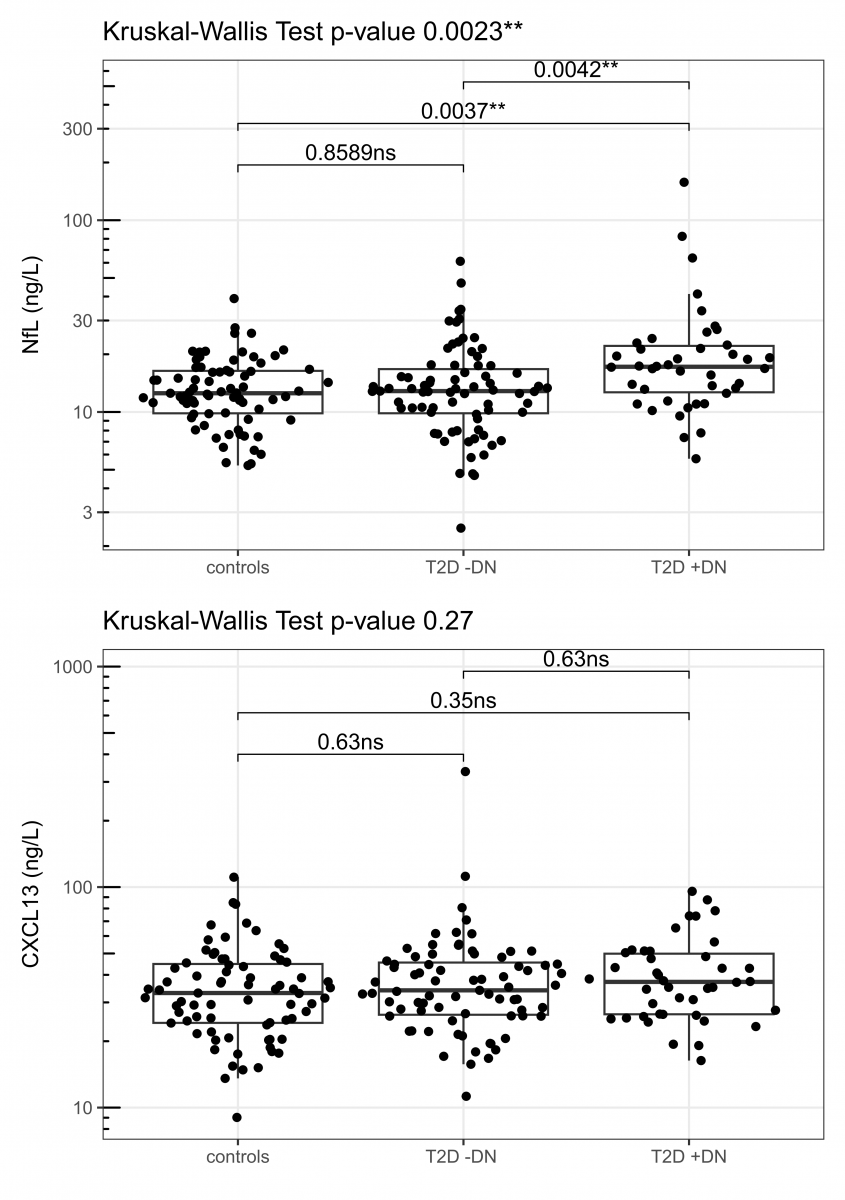
Figure 1. Boxplot: NfL and CXCL13 com-parison of levels across three groups. The line that divides the box into two parts represents the median, and the top and bottom of the box show the lower 25th (Q1) and upper 75th (Q3) quartile. The extreme line shows Q1-1.5xIQR to Q3+1.5xIQR.
Abbreviations: T2D: Type 2 Diabetes; DPN: Diabetic Neuropathy.
Correlation Analysis of NfL, HbA1c, and Urine Albumin-creatinine Ratio Across Different Patient Groups
Figure 2 illustrates the relationship between NfL levels (ng/L) and HbA1c (mmol/mol) for all groups. A non-significant negative correlation was observed for T2D +DPN (R = -0.082, p = 0.6), while T2D -DPN showed a non-significant positive correlation (R = 0.048, p = 0.68). Controls showed a weak but statistically significant positive correlation (R = 0.28, p = 0.015).
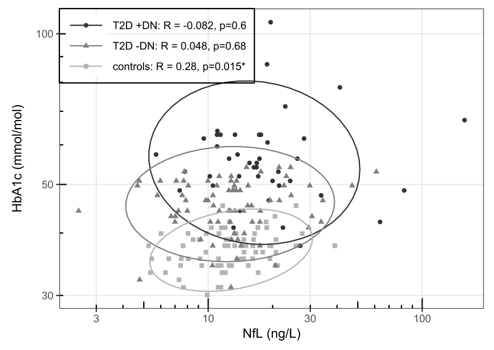
Figure 2. Spearman correlation between NfL(ng/L) and HbA1c (mmol/L), Ellipses illustrate 95 CI. Included groups are T2D +DPN, T2D –DPN and controls.
Abbreviations: T2D: Type 2 Diabetes; DPN: Diabetic Polyneuropathy.
Figure 3 shows the relationship between NfL levels and the urine albumin/creatinine ratio for T2D +DPN and T2D -DPN. A moderate and significant positive correlation was found between NfL and the urine albumin/creatinine ratio in the T2D +DPN group (R = 0.59, p = 3.3e-05). No significant correlation was observed in the T2D –DPN group (R = 0.04, p = 0.73).
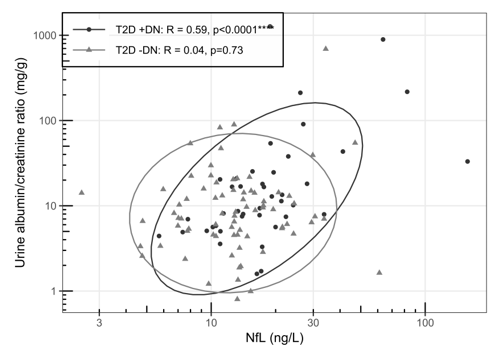
Figure 3. Spearman correlation between NfL(ng/L) and Urine albumin-creatinine ratio (mg/g). Ellipses illustrate 95 CI. Included groups are T2D +DPN and T2D –DPN, controls – no data.
Abbreviations: T2D: Type 2 Diabetes; DPN: Diabetic Polyneuropathy.
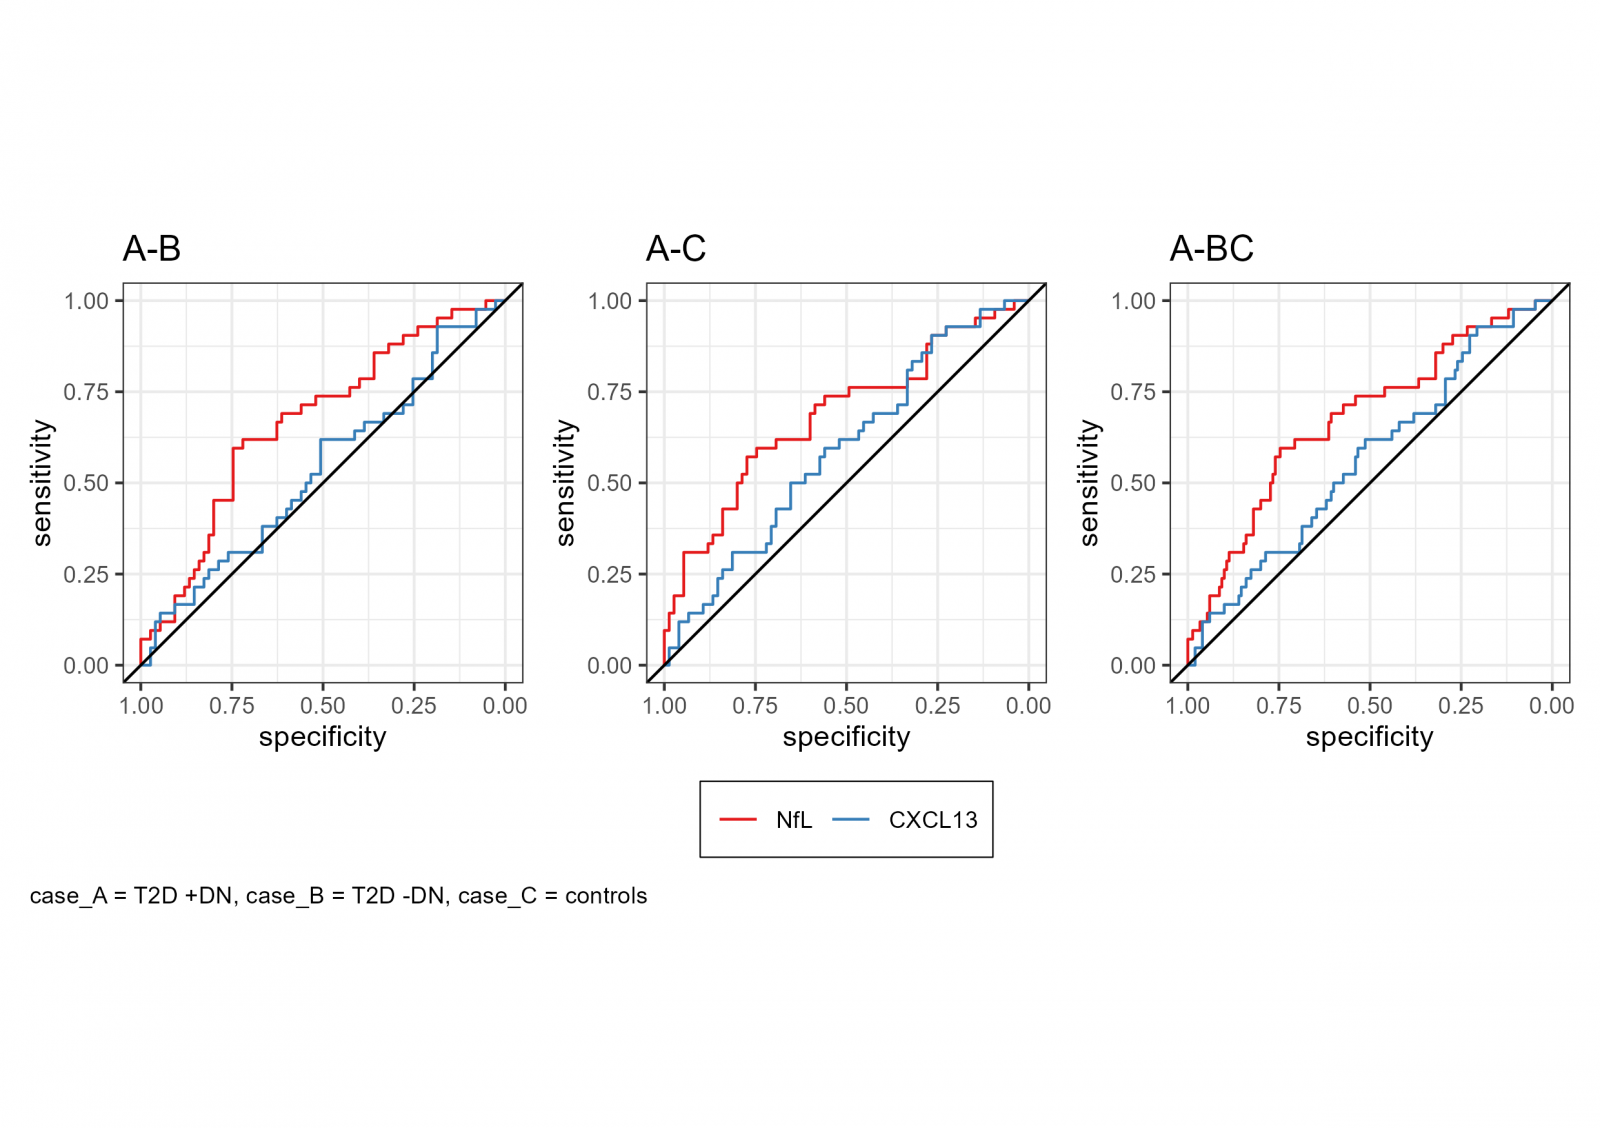
ROC curves were generated to assess the diagnostic performance of NfL and CXCL13 in distinguishing between different groups within the cohort. NfL demonstrated moderate discriminatory ability between T2D patients with and without DPN (AUC = 0.667, 95% CI: 0.565–0.769) and between T2D patients +DPN and healthy controls (AUC = 0.685, 95% CI: 0.580–0.789). When compared to the combined group of T2D -DPN and controls, NfL showed a weak to moderate classification performance (AUC = 0.676, 95% CI: 0.582–0.770). CXCL13 showed no discriminatory ability in all comparisons, with AUC values close to 0.5. ROC curve analysis of NfL and CXCL13 is presented in Supplementary Table S2 and Figure S1.
DISCUSSION
With this study, we aimed to assess the biomarker potential of both NfL and CXCL13 as detection markers for DPN in patients with T2D. To our knowledge, this is the first study to investigate CXCL13 in this context.
Our study found that NfL levels are significantly higher in patients with T2D +DPN compared to both patients with T2D –DPN as well as individuals without T2D and neurological disorders. These findings suggest that NfL levels are higher in individuals with DPN and may serve as a potential biomarker for axonal damage in this population. However, the observed AUC values suggest that while NfL may have potential utility in DPN diagnosis, it is insufficient as a standalone biomarker. The results also demonstrated a positive association between NfL levels and urine albumin/creatinine ratio in T2D patients with DPN.
In agreement with our findings, previous studies have reported higher NfL levels in patients with T2D and DPN [24,25]. However, direct comparisons across studies are challenging due to several factors. In the ADDITION-DK study, Määttä et al. [25] used a longitudinal study design to assess changes in NfL over time in a screen-detected T2D population. In contrast, our study sought to determine whether NfL levels, measured at a single time point regardless of the duration of diabetes, could serve as an initial biomarker for identifying DPN, as defined by ICD codes. Furthermore, variations in diabetes duration and diabetes type complicate direct comparisons. Maalmi et al. [24] included a mixed cohort of early-diagnosed type 1 and type 2 diabetes patients in a cross-sectional design. By contrast, our study cohort comprised participants with a diabetes duration ranging from a median of 6 to 9 years, which aligns more closely with the ADDITION-DK cohort [25].
Additionally, differences in diagnostic criteria for DPN further hinder direct comparisons. In our study, DPN was identified by linking the cohort to the Danish Civil Registration System [37] and the Danish National Patient Registry [35], utilizing ICD-10 codes to identify T2D patients with hospital-diagnosed DPN [38]. Therefore, we lack information regarding the potential electrophysiological or clinical assessments underlying the diagnosis of DPN in our cohort. Consequently, we were unable to apply the Toronto criteria, which Määttä et al. [25] and Maalmi et al. [24] used to define DPN in their respective studies. Despite these differences, our results point in the same direction.
Our observation of associations between NfL and waist circumference, BMI, and kidney function aligns with previous cross-sectional [24,40] and longitudinal studies [25]. The present work identified a significant positive correlation between NfL levels and the urine albumin-creatinine ratio, suggesting that higher NfL levels are associated with increased albuminuria. This association may indicate that both biomarkers reflect a shared underlying mechanism of tissue damage. Blood levels of NfL have been shown to be influenced by kidney function, however the mechanisms behind this are unclear [41-43]. Previous research suggests that it is possibly due to reduced clearance of neurofilament proteins [40,44,45). Yet, given that NfL is a 61.5 kDa protein [6], it should not be filtered at the glomerular level. Hypothetically, therefor one might expect NfL levels to be even higher in patients with impaired kidney function and axonal damage. A recent study investigated if NfL is excreted in the urine, and whether this depends on plasma NfL levels and kidney function in terms of eGFR and urine albumin-creatinine ratio [46]. Their results indicate that increased plasma NfL level in patients with low eGFR is not caused by impaired urinary excretion – on the contrary, an increased excretion was observed in patient with low eGFR and increased urine albumin-creatinine ratio.
Despite significant differences in median HbA1c levels, we found no correlation between HbA1c and NfL in T2D patients with or without DPN. In contrast, a significant positive correlation was observed in the control group. Previous studies have reported conflicting findings regarding the association between HbA1c and NfL levels. While other studies [43,47] observed a positive correlation between change in HbA1c and NfL, our study and Määttä et al. [25] did not find such an association. These discrepancies may be influenced by differences in study design, population characteristics and genetic differences, diabetes duration and glycemic control. This may also indicate that, in individuals without T2D, variations in glycemic regulation, age and body composition are more readily reflected in NfL levels.
These observations highlight the need for further research to better understand how glycemic control and metabolic factors influence NfL levels in both diabetic and non-diabetic individuals. Furthermore, investigating the release of NfL from damaged neurons, as well as its metabolism and excretion, is crucial for improving the interpretation of NfL levels in both healthy individuals and people with diabetes.
CXCL13 has been identified as a potential biomarker in neurological diseases [26]. CXCL13 is known to play a role in B-cell recruitment and migration, which is critical for the humoral immune response in neuroinflammation [48]. Previous research has shown that macrophages, which induce demyelination, express CXCL13 in human and mouse models of inflammatory demyelinating neuropathies [30]. The same study found higher serum levels of CXCL13 in patients with inflammatory demyelinating neuropathic disease [30]. Furthermore, findings from mouse models suggest that increased CXC chemokine signaling contributes to nerve damage and pain hypersensitivity in diabetes [29]. Despite these findings, CXCL13 levels did not differ significantly between the groups in our study. The results suggest that CXCL13 levels are similarly distributed across all groups, indicating that this chemokine may not be associated with diabetic neuropathy in the study population. As no prior studies have specifically examined CXCL13 levels in DPN, direct comparisons with other studies are not possible.
The strength of our study is the well-characterized participants from an diabetes-control biobank [31] with access to every single patient´s entry diagnoses as well as anthropometrics and extensive laboratory data. Another strength is that the diabetes patients with DPN were diagnosed in their usual hospital clinical settings according to current guidelines [38], as diabetic neuropathy is a diagnosis of exclusion [3]. In addition, NfL and CXCL13 were measured with the highly sensitive SiMoA technology.
Our study includes the following limitations: The study lacks longitudinal blood samples and repeated questionnaire assessments, which would have enabled biochemical and anthropometric follow-up over time. As a result, the study is limited to data collected at the time of cohort entry [31]. Additionally, we did not include patients with type 1 diabetes, preventing comparisons of NfL levels between diabetes types. Potential confounders such as age, NfL levels before DPN diagnosis, kidney function and BMI and small sample size should also be acknowledged. In addition, a limitation of our study is that T2D patients with DPN were selected based on ICD-10 codes. This approach may have led to an underrepresentation of early or subclinical DPN cases. This is a major limitation, as ICD-10 coding primarily captures clinically overt cases, whereas patients with mild or early neuropathic changes may remain undiagnosed. This issue is particularly relevant in Denmark, where general practitioners most often manage uncomplicated diabetes, and mild DPN symptoms may go unrecognized. Consequently, the true prevalence of DPN in our study may be underestimated. Future studies should consider supplementing ICD-10 data with objective diagnostic measures or validated neuropathy screening tools as the Toronto Clinical Neuropathy score [5] to ensure a consistent definition and detection of DPN. Furthermore, the lack of a standardized approach for staging DPN prevents us from assessing associations between NfL levels and DPN progression [46].
However, another study [49] concluded that the lack of specificity of NfL for peripheral nerve damage limits its usefulness as a standalone biomarker for DPN, as elevated NfL levels may also stem from CNS pathologies, age and BMI. Therefore, NfL should not be used alone in the diagnosis of DPN in patients with T2D. Nevertheless, NfL is specific for axonal damage, and associations with DPN already at an early diabetes disease stage have been showed [24]. If the associations between NfL, T2D and DPN reported in our study is validated in a longitudinal prospective randomized trial, NfL may serve as a potential biomarker for individual, longitudinal monitoring of patients with T2D and DPN in an everyday clinical setting [47]. Given the limitations of NfL as a standalone biomarker for DPN, identifying additional markers of peripheral nerve damage remains crucial. One such candidate is peripherin, an intermediate filament protein almost exclusively expressed in peripheral nerve axons. Keddie el al. [50] found, that peripherin selectively increases in peripheral nerve injury, helping to distinguish peripherally derived elevations in NfL from those of central origin.
CONCLUSIONS
This study found higher NfL levels in patients with T2D and DPN, supporting its potential as a detecting biomarker for axonal damage. However, due to its lack of specificity, NfL alone is insufficient for diagnosing DPN. Nonetheless, NfL may serve as a non-invasive and cost-effective biomarker for individual, longitudinal monitoring of DPN. In contrast, CXCL13 levels did not differ between groups, suggesting no association with DPN. While NfL may aid in monitoring neuropathy progression, future longitudinal studies are needed to confirm its clinical utility, together with other biomarkers.
ETHICS
The Vejle Diabetes Biobank study was approved by the Danish Data Protection Agency (j. no. 2006-53-1385 and j. no. 2008-58-0035) and by The Regional Scientific Ethical Committees for Southern Denmark (j. no. S-20080097), and was conducted in accordance with the principles of the Declaration of Helsinki, version 1996. All study participants gave written consent for storage of blood samples and urine, stored frozen in the biobank for subsequent research. The current study underwent renewed ethical approval by the Danish Data Protection Agency (j. no. 2006-53-1385 and j. no. 2008-58-0035) and by The Regional Committees on Health Research Ethics for Southern Denmark (j. no S-20210125) prior to analysis of biobank samples.
AUTHOR CONTRIBUTIONS STATEMENT
J.R.S.O wrote the manuscript and contributed to the design of the study. D.A.O collected the NfL and CXCL13-data. H.C. carried out the statistical analysis. J.R.S.O and I.B. provided input on the statistical analysis. I.V., O.W.R., W.M. and E.R.B.P. contributed to the design of the study. I.V., O.W.R. and W.M. initiated the idea of the study. I.V., W.M., D.A.O, H.C. and E.R.B.P. contributed to the editing of the manuscript.
All authors have accepted responsibility for the entire content of this manuscript and approved its submission.
DATA AVAILABILITY STATEMENT
The datasets generated and/or analyzed during the current study are available from the corresponding author on reasonable request.
Due to the Danish legislation, data can only be available in anonymized form.
CONFLICT OF INTEREST
The authors state no conflict of interest.
FUNDING
This project received funding from Sygehus Lillebaelt Research Council to support analytical expenses. Reagents and analysis were provided by Department of Biochemistry & Immunology, University Hospital of Southern Denmark, Vejle, Denmark.
REFERENCES
- Organization WH. (2024). Diabetes: World Health Organization. Available at: https://www.who.int/news-room/fact-sheets/detail/diabetes
- Feldman EL, Callaghan BC, Pop-Busui R, Zochodne DW, Wright DE, Bennett DL, et al. (2019). Diabetic neuropathy. Nat Rev Dis Primers. 5(1):41.
- Pop-Busui R, Boulton AJ, Feldman EL, Bril V, Freeman R, Malik RA, et al. (2017). Diabetic Neuropathy: A Position Statement by the American Diabetes Association. Diabetes Care. 40(1):136-154.
- Jensen TS, Karlsson P, Gylfadottir SS, Andersen ST, Bennett DL, Tankisi H, et al. (2021). Painful and non-painful diabetic neuropathy, diagnostic challenges and implications for future management. Brain. 144(6):1632-1645.
- Tesfaye S, Boulton AJ, Dyck PJ, Freeman R, Horowitz M, Kempler P, et al. (2010). Diabetic neuropathies: update on definitions, diagnostic criteria, estimation of severity, and treatments. Diabetes Care. 33(10):2285-2293.
- Khalil M, Teunissen CE, Otto M, Piehl F, Sormani MP, Gattringer T, et al. (2018). Neurofilaments as biomarkers in neurological disorders. Nat Rev Neurol. 14(10):577-589.
- Gaetani L, Blennow K, Calabresi P, Di Filippo M, Parnetti L, Zetterberg H. (2019). Neurofilament light chain as a biomarker in neurological disorders. J Neurol Neurosurg Psychiatry. 90(8):870-881.
- Bomont P. (2021). The dazzling rise of neurofilaments: Physiological functions and roles as biomarkers. Curr Opin Cell Biol. 68:181-191.
- Sainio MT, Rasila T, Molchanova SM, Järvilehto J, Torregrosa-Muñumer R, Harjuhaahto S, et al. (2021). Neurofilament Light Regulates Axon Caliber, Synaptic Activity, and Organelle Trafficking in Cultured Human Motor Neurons. Front Cell Dev Biol. 9:820105.
- Gafson AR, Barthélemy NR, Bomont P, Carare RO, Durham HD, Julien JP, et al. (2020). Neurofilaments: neurobiological foundations for biomarker applications. Brain. 143(7):1975-1998.
- Mollenhauer B, Dakna M, Kruse N, Galasko D, Foroud T, Zetterberg H, et al. (2020). Validation of Serum Neurofilament Light Chain as a Biomarker of Parkinson's Disease Progression. Mov Disord. 35(11):1999-2008.
- Kouchaki E, Dashti F, Mirazimi SMA, Alirezaei Z, Jafari SH, Hamblin MR, et al. (2021). Neurofilament light chain as a biomarker for diagnosis of multiple sclerosis. Excli j. 20:1308-1325.
- Verde F, Otto M, Silani V. (2021). Neurofilament Light Chain as Biomarker for Amyotrophic Lateral Sclerosis and Frontotemporal Dementia. Front Neurosci. 15:679199.
- Bacioglu M, Maia LF, Preische O, Schelle J, Apel A, Kaeser SA, et al. (2016). Neurofilament Light Chain in Blood and CSF as Marker of Disease Progression in Mouse Models and in Neurodegenerative Diseases. Neuron. 91(1):56-66.
- Thebault S, Booth RA, Freedman MS. (2020). Blood Neurofilament Light Chain: The Neurologist's Troponin? Biomedicines. 8(11):523.
- Thebault S, Booth RA, Rush CA, MacLean H, Freedman MS. (2021). Serum Neurofilament Light Chain Measurement in MS: Hurdles to Clinical Translation. Front Neurosci. 15:654942.
- Pukoli D, Polyák H, Rajda C, Vécsei L. (2021). Kynurenines and Neurofilament Light Chain in Multiple Sclerosis. Front Neurosci. 15:658202.
- Karantali E, Kazis D, Chatzikonstantinou S, Petridis F, Mavroudis I. (2021). The role of neurofilament light chain in frontotemporal dementia: a meta-analysis. Aging Clin Exp Res. 33(4):869-881.
- Altmann P, De Simoni D, Kaider A, Ludwig B, Rath J, Leutmezer F, et al. (2020). Increased serum neurofilament light chain concentration indicates poor outcome in Guillain-Barré syndrome. J Neuroinflammation. 17(1):86.
- Fukami Y, Iijima M, Koike H, Yamada S, Hashizume A, Katsuno M. (2021). Association of serum neurofilament light chain levels with clinicopathology of chronic inflammatory demyelinating polyneuropathy, including NF155 reactive patients. J Neurol. 268(10):3835-3844.
- Kim SH, Choi MK, Park NY, Hyun JW, Lee MY, Kim HJ, et al. (2020). Serum neurofilament light chain levels as a biomarker of neuroaxonal injury and severity of oxaliplatin-induced peripheral neuropathy. Sci Rep. 10(1):7995.
- Millere E, Rots D, Simrén J, Ashton NJ, Kupats E, Micule I, et al. (2021). Plasma neurofilament light chain as a potential biomarker in Charcot-Marie-Tooth disease. Eur J Neurol. 28(3):974-981.
- van Lieverloo GGA, Wieske L, Verhamme C, Vrancken AFJ, van Doorn PA, Michalak Z, et al. (2019). Serum neurofilament light chain in chronic inflammatory demyelinating polyneuropathy. J Peripher Nerv Syst. 24(2):187-194.
- Maalmi H, Strom A, Petrera A, Hauck SM, Strassburger K, Kuss O, et al. (2023). Serum neurofilament light chain: a novel biomarker for early diabetic sensorimotor polyneuropathy. Diabetologia. 66(3):579-589.
- Määttä LL, Andersen ST, Parkner T, Hviid CVB, Bjerg L, Kural MA, et al. (2024). Longitudinal Change in Serum Neurofilament Light Chain in Type 2 Diabetes and Early Diabetic Polyneuropathy: ADDITION-Denmark. Diabetes Care. 47(6):986-994.
- Huber AK, Irani DN. (2015). Targeting CXCL13 During Neuroinflammation. Adv Neuroimmune Biol. 6(1):1-8.
- Zheng K, Chen M, Xu X, Li P, Yin C, Wang J, et al. (2024). Chemokine CXCL13-CXCR5 signaling in neuroinflammation and pathogenesis of chronic pain and neurological diseases. Cell Mol Biol Lett. 29(1):134.
- Salvador AF, de Lima KA, Kipnis J. (2021). Neuromodulation by the immune system: a focus on cytokines. Nat Rev Immunol. 21(8):526-541.
- Zychowska M, Rojewska E, Pilat D, Mika J. (2015). The role of some chemokines from the CXC subfamily in a mouse model of diabetic neuropathy. J Diabetes Res. 2015:750182.
- Kim YH, Jang SY, Shin YK, Jo YR, Yoon BA, Nam SH, et al. (2019). Serum CXCL13 reflects local B-cell mediated inflammatory demyelinating peripheral neuropathy. Sci Rep. 9(1):16535.
- Petersen ER, Nielsen AA, Christensen H, Hansen T, Pedersen O, Christensen CK, et al. (2016). Vejle Diabetes Biobank - a resource for studies of the etiologies of diabetes and its comorbidities. Clin Epidemiol. 8:393-413.
- Pedersen CB. (2011). The Danish Civil Registration System. Scand J Public Health. 39(7 Suppl):22-25.
- Pedersen CB, Gøtzsche H, Møller JO, Mortensen PB. (2006). The Danish Civil Registration System. A cohort of eight million persons. Dan Med Bull. 53(4):441-449.
- Kristensen JK, Sandbaek A, Lassen JF, Bro F, Lauritzen T. (2001). Use and validation of public data files for identification of the diabetic population in a Danish county. Dan Med Bull. 48(1):33-37.
- Schmidt M, Schmidt SA, Sandegaard JL, Ehrenstein V, Pedersen L, Sørensen HT. (2015). The Danish National Patient Registry: a review of content, data quality, and research potential. Clin Epidemiol. 7:449-490.
- Levey AS, Stevens LA, Schmid CH, Zhang YL, Castro AF 3rd, Feldman HI, et al. (2009). A new equation to estimate glomerular filtration rate. Ann Intern Med. 150(9):604-612.
- Schmidt M, Pedersen L, Sørensen HT. (2014). The Danish Civil Registration System as a tool in epidemiology. Eur J Epidemiol. 29(8):541-549.
- Christensen DH, Knudsen ST, Nicolaisen SK, Andersen H, Callaghan BC, Finnerup NB, et al. (2019). Can diabetic polyneuropathy and foot ulcers in patients with type 2 diabetes be accurately identified based on ICD-10 hospital diagnoses and drug prescriptions? Clin Epidemiol. 11:311-321.
- Wilson DH, Rissin DM, Kan CW, Fournier DR, Piech T, Campbell TG, et al. (2016). The Simoa HD-1 Analyzer: A Novel Fully Automated Digital Immunoassay Analyzer with Single-Molecule Sensitivity and Multiplexing. J Lab Autom. 21(4):533-547.
- Koini M, Pirpamer L, Hofer E, Buchmann A, Pinter D, Ropele S, et al. (2021). Factors influencing serum neurofilament light chain levels in normal aging. Aging (Albany NY). 13(24):25729-25738.
- Akamine S, Marutani N, Kanayama D, Gotoh S, Maruyama R, Yanagida K, et al. (2020). Renal function is associated with blood neurofilament light chain level in older adults. Sci Rep. 10(1):20350.
- Ladang A, Kovacs S, Lengelé L, Locquet M, Reginster JY, Bruyère O, et al. (2022). Neurofilament light chain concentration in an aging population. Aging Clin Exp Res. 34(2):331-339.
- Korley FK, Goldstick J, Mastali M, Van Eyk JE, Barsan W, Meurer WJ, et al. (2019). Serum NfL (Neurofilament Light Chain) Levels and Incident Stroke in Adults With Diabetes Mellitus. Stroke. 50(7):1669-1675.
- Dittrich A, Ashton NJ, Zetterberg H, Blennow K, Zettergren A, Simrén J, et al. (2023). Association of Chronic Kidney Disease With Plasma NfL and Other Biomarkers of Neurodegeneration: The H70 Birth Cohort Study in Gothenburg. Neurology. 101(3):e277-e288.
- Tang R, Panizzon MS, Elman JA, Gillespie NA, Hauger RL, Rissman RA, et al. (2022). Association of neurofilament light chain with renal function: mechanisms and clinical implications. Alzheimers Res Ther. 14(1):189.
- Tybirk L, Knudsen CS, Parkner T. (2025). Neurofilament light chain - Can it be measured in urine? Clin Chim Acta. 569:120163.
- Fridman V, Sillau S, Ritchie A, Bockhorst J, Coughlan C, Araya P, et al. (2023). Plasma neurofilament light chain concentrations are elevated in youth-onset type 2 diabetes and associated with neuropathy. J Peripher Nerv Syst. 28(3):460-470.
- Kowarik MC, Cepok S, Sellner J, Grummel V, Weber MS, Korn T, et al. (2012). CXCL13 is the major determinant for B cell recruitment to the CSF during neuroinflammation. J Neuroinflammation. 9:93.
- Määttä LL, Andersen ST, Parkner T, Hviid CVB, Bjerg L, Kural MA, et al. (2023). Serum neurofilament light chain - A potential biomarker for polyneuropathy in type 2 diabetes? Diabetes Res Clin Pract. 205:110988.
- Keddie S, Smyth D, Keh RYS, Chou MKL, Grant D, Surana S, et al. (2023). Peripherin is a biomarker of axonal damage in peripheral nervous system disease. Brain. 146(11):4562-4573.
SUPPLEMENTARY
Supplementary table S1. Inclusion and exclusion diagnosis ICD-10 codes, from the Danish National Patient Registry [35]
|
Inclusion: ICD-10 codes and definition |
Exclusion: ICD-10 codes and definition |
||
|
E11.4 |
Type 2 diabetes mellitus with neurological complications |
G11 |
Hereditary ataxia |
|
E11.5 |
Type 2 diabetes with peripheral circulatory complications |
G11.1 |
Early-onset cerebellar ataxia |
|
E14.4 |
Unspecified diabetes mellitus with neurological complications |
G12 |
Spinal muscular atrophy and related syndromes |
|
E14.5 |
Unspecified diabetes mellitus with peripheral circulatory complications |
G12.2 |
Motor neuron disease |
|
G63.2 |
Diabetic polyneuropathy |
G12.8 |
Other spinal muscular atrophies and related syndromes |
|
|
G30 |
Alzheimer disease |
|
|
G30.9 |
Alzheimer disease, unspecified |
||
|
G35 |
Multiple sclerosis |
||
|
G36.0 |
Neuromyelitis optica |
||
|
G60 |
Hereditary motor and sensory neuropathy |
||
|
G60.0 |
Hereditary motor and sensory neuropathy |
||
|
G61 |
Guillain-Barré syndrome |
||
Supplementary table S2. Areas under the curve for NfL and CXCL13
|
Group |
NfL |
CXCL13 |
||
|
AUC |
95% CI |
AUC |
95% CI |
|
|
T2D +DPN ; T2D -DPN |
0,667 |
(0,565-0,769) |
0,537 |
(0,427-0,648) |
|
T2D +DPN ; Controls |
0,685 |
(0,580-0,789) |
0.590 |
(0,484-0,696) |
|
T2D +DPN ; T2D - DPN & Controls |
0,676 |
(0,582-0,770) |
0,564 |
(0,467-0,661) |
The area under the curve (AUC) values, along with their 95% confidence intervals (CI). AUC’s for assessing the diagnostic performance of NfL and CXCL13 in distinguishing between different groups within the cohort.
Supplementary Figure S1 – ROC-curves